

“Only buy something that you’d be perfectly happy to hold if the market shut down for 10 years.”
— Warren Buffett
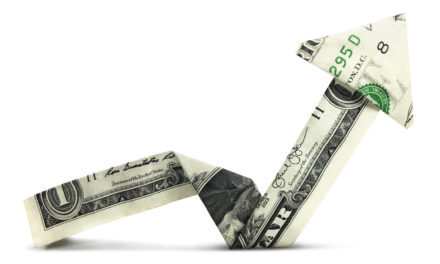
Steel Dynamics Inc. (NASD: STLD) delivered an exceptional 10-year total return for investors who bought shares in 2016 and reinvested dividends. Over the period from 06/27/2016 through 06/25/2026, a $10,000 investment in STLD grew to $132,135.81, illustrating how long-term compounding can transform returns when strong share-price appreciation is paired with ongoing dividend payments.
The central point is not merely that STLD rose sharply. It is that the stock’s total return was driven by both capital appreciation and the accumulation of additional shares through dividend reinvestment. For long-horizon investors, that distinction matters: total return provides a more complete picture than price performance alone.
STLD 10-Year Return Details
| Start date: | 06/27/2016 |
|
|||
| End date: | 06/25/2026 | ||||
| Start price/share: | $23.20 | ||||
| End price/share: | $251.00 | ||||
| Starting shares: | 431.03 | ||||
| Ending shares: | 526.41 | ||||
| Dividends reinvested/share: | $12.22 | ||||
| Total return: | 1,221.28% | ||||
| Average annual return: | 29.45% | ||||
| Starting investment: | $10,000.00 | ||||
| Ending investment: | $132,135.81 | ||||
The figures above imply that STLD compounded at an annualized rate of 29.45% over the period. Put differently, every $1 invested became roughly $13.21 when dividends were reinvested. That is an unusually strong long-term result for an industrial and materials company, sectors that are often associated with cyclical earnings and uneven market sentiment.
These numbers were computed with the Dividend Channel DRIP Returns Calculator.
What Drove STLD’s Total Return?
STLD’s decade-long gain came from two sources:
- Share-price appreciation: the stock rose from $23.20 to $251.00 per share.
- Dividend reinvestment: cash dividends were used to purchase additional shares, increasing the share count from 431.03 to 526.41.
This is an important distinction. A stock can generate a strong headline return through price appreciation alone, but dividend reinvestment adds a second layer of compounding. In STLD’s case, the ending share count increased by more than 95 shares over the period, which materially boosted the final portfolio value.
Over the 10-year span, Steel Dynamics paid $12.22 per share in dividends, based on the assumptions used in the return calculation. Reinvestment means those distributions did not simply provide income; they also became additional capital working inside the position.
Current Yield and Yield on Cost
Based on the most recent annualized dividend rate of $2.12 per share, STLD has a current yield of approximately 0.84% using the stated share price of $251.00. That current yield is modest, but it does not fully capture the economics for an investor who entered the position at a much lower price.
Using the original purchase price of $23.20 per share, the current annualized dividend translates into a yield on cost of 9.14%. Yield on cost measures the current dividend relative to the initial entry price, and it can help illustrate how dividend growth and price appreciation interact over a long holding period.
For clarity:
- Current yield: annual dividend divided by the current share price.
- Yield on cost: annual dividend divided by the original purchase price.
Yield on cost does not determine the stock’s present market value or future return potential, but it does show how a successful long-term holding can alter the income profile of the original investment.
Why the Result Stands Out
Steel is a cyclical business, and steel equities often trade through pronounced booms and downturns tied to pricing, demand, capacity utilization, raw-material costs, and industrial activity. A 10-year return profile like STLD’s is therefore notable not only for its magnitude, but also because it was achieved in an industry where timing, capital discipline, and operating execution tend to matter greatly.
That context also helps explain why evaluating a long-term holding requires more than looking at a single year’s earnings or a short-term move in commodity prices. The market’s view of a steel producer can change quickly, but the value created over a decade is more closely tied to sustained profitability, balance-sheet management, capital allocation, and the ability to compound through multiple phases of the cycle.
Key Takeaway
An investment in Steel Dynamics stock in mid-2016 produced a remarkable long-term total return by mid-2026. A $10,000 position grew to $132,135.81, with dividend reinvestment increasing the share count and amplifying the effect of a major rise in the stock price. The broader lesson is straightforward: when a company delivers strong business performance over time, patient ownership and reinvested dividends can produce results that short-term market moves may obscure.
“While it might seem that anyone can be a value investor, the essential characteristics of this type of investor-patience, discipline, and risk aversion-may well be genetically determined.” — Seth Klarman

