The most recent short interest data has just been released for the 01/15/2019 settlement date, and we here at BDC Investor have sifted through this fresh data and screened out these five BDCs. A metric we find particularly useful when comparing short interest data is the “days to cover” metric because it considers both the total shares short and the average daily volume of shares traded. For the five BDCs below, we have detected a notable change in days to cover, not just from the prior reporting period but also going back a full month. The table below summarizes what we found, with the five columns showing data for each of the five BDCs, and the rows showing the days to cover values first from the 12/14/2018 reporting period, then the most recent 01/15/2019 reporting period, followed by the change and percentage change:
| OXSQ | HRZN | HTGC | TPVG | SUNS | |
|---|---|---|---|---|---|
| 12/14/2018 | 1.36 | 0.32 | 0.61 | 0.32 | 0.60 |
| 01/15/2019 | 5.15 | 1.84 | 1.91 | 1.43 | 1.68 |
| Change | 3.79 | 1.52 | 1.30 | 1.10 | 1.08 |
| % Change | 278.93% | 481.26% | 214.60% | 339.31% | 181.66% |

All BDCs:
Business Development Company List »
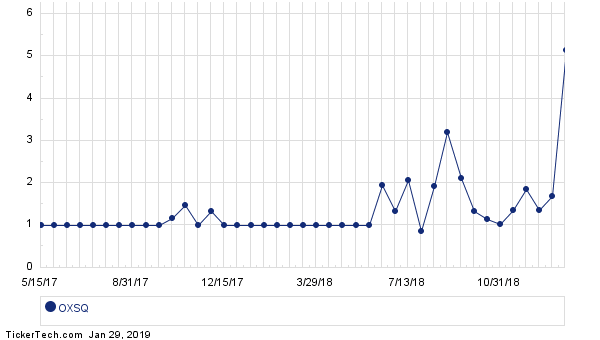
At Oxford Square Capital Corp (NASD: OXSQ), average daily volume at the 01/15/2019 settlement saw a decrease to 181,467, as compared to 203,784 at the 12/14/2018 report. That brought days to cover up to 5.15, a 278.93% increase from the 1.36 days to cover calculated at the 12/14/2018 settlement date. Looking at total shares short, there was a 658,214 share increase to 935,433, a rise of 237.43% since 12/14/2018. The below chart shows the historical days to cover for OXSQ at previous short interest release dates:
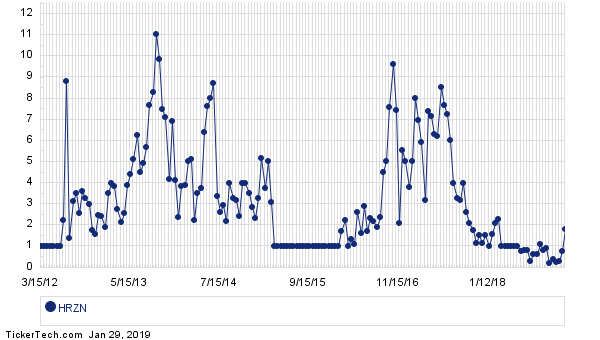
Meanwhile at Horizon Technology Finance Corporation (NASD: HRZN), average daily volume at the 01/15/2019 settlement moved higher to 79,418, as compared to 63,365 at the 12/14/2018 report. That brought days to cover up to 1.84, a 481.26% increase from the 0.32 days to cover calculated at the 12/14/2018 settlement date. Looking at total shares short, there was a 125,910 share increase to 145,943, an increase of 628.51% since 12/14/2018. The chart below shows the historical days to cover for HRZN at previous short interest release dates:
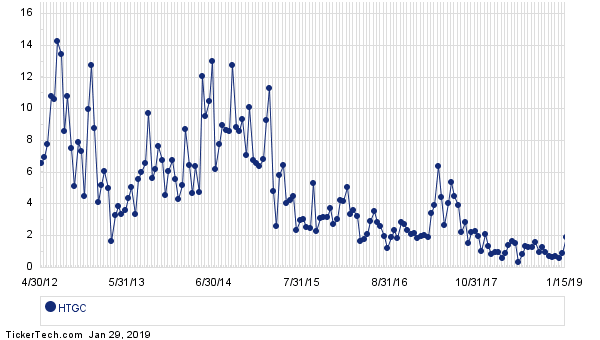
Over at Hercules Technology Growth Capital (NYSE: HTGC), average daily volume at the 01/15/2019 settlement decreased to 423,634, as compared to 586,650 at the 12/14/2018 report. The resulting days to cover value was up to 1.91, a 214.60% increase from the 0.61 days to cover calculated at the 12/14/2018 settlement date. Looking at the running total of all outstanding shorted shares, there was a 452,808 share increase to 808,851, a 127.18% increase since 12/14/2018. The below chart plots the historical days to cover for HTGC at prior short interest release dates over time:
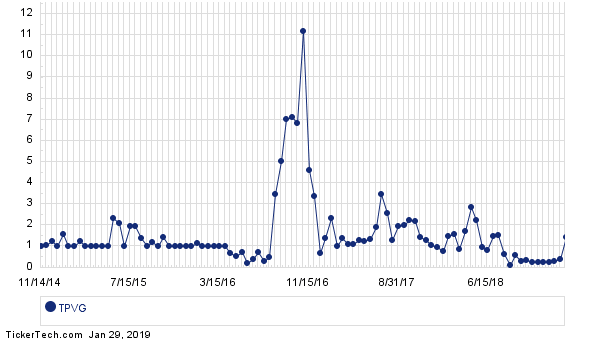
At Triplepoint Venture Growth BDC Corp (NYSE: TPVG), average daily volume at the 01/15/2019 settlement declined to 116,931, as compared to 239,747 at the 12/14/2018 report. The days to cover calculation moved up to 1.43, a 339.31% increase from the 0.32 days to cover calculated at the 12/14/2018 settlement date. Looking at the total of all open short positions, there was a 88,952 share increase to 166,800, a 114.26% rise since 12/14/2018. The chart below shows the days to cover over time for TPVG at previous short interest release dates:
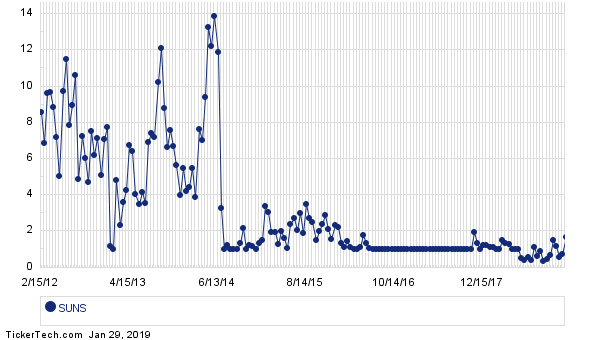
And at Solar Senior Capital Ltd. (NASD: SUNS), average daily volume at the 01/15/2019 settlement decreased to 32,476, as compared to 66,845 at the 12/14/2018 report. That brought days to cover up to 1.68, a 181.66% increase from the 0.60 days to cover calculated at the 12/14/2018 settlement date. Looking at total shares short, there was a 14,696 share increase to 54,583, an increase of 36.84% since 12/14/2018. The following chart plots the historical days to cover for SUNS at previous short interest release dates over time:
An increased “days to cover” value could indicate that short sellers are using these BDCs to hedge long bets on other BDCs or elsewhere, or could also mean that short sellers believe the stocks will decline in price. When short sellers eventually cover their positions, by definition there must be buying activity because a share that is currently sold short must be purchased to be covered. So investors tend to keep an eye on that days to cover metric, because a high value could predict a sharper price increase should a company put out some unexpectedly good news — short sellers might then rush to cover their positions, and if the days to cover number is high, it would then be more difficult to close those positions without sending a stock higher (until the higher price produces enough sellers to generate the necessary volume the short sellers need to close their positions).
In afternoon trading Tuesday, OXSQ was up about 0.3% on the day, HRZN was trading flat, HTGC was trading flat, TPVG was trading flat, and SUNS was trading flat.
